– Filter setting
Through this filtering section, administrator users are guided to design the visualisation of data, which will be displayed in the front-end interface.
Project contributors can decide which layers and sub-layers of data can be visualised in the front interface, and how data should be displayed. Therefore, they can decide the degree of freedom of final users in knowing the information included within data.
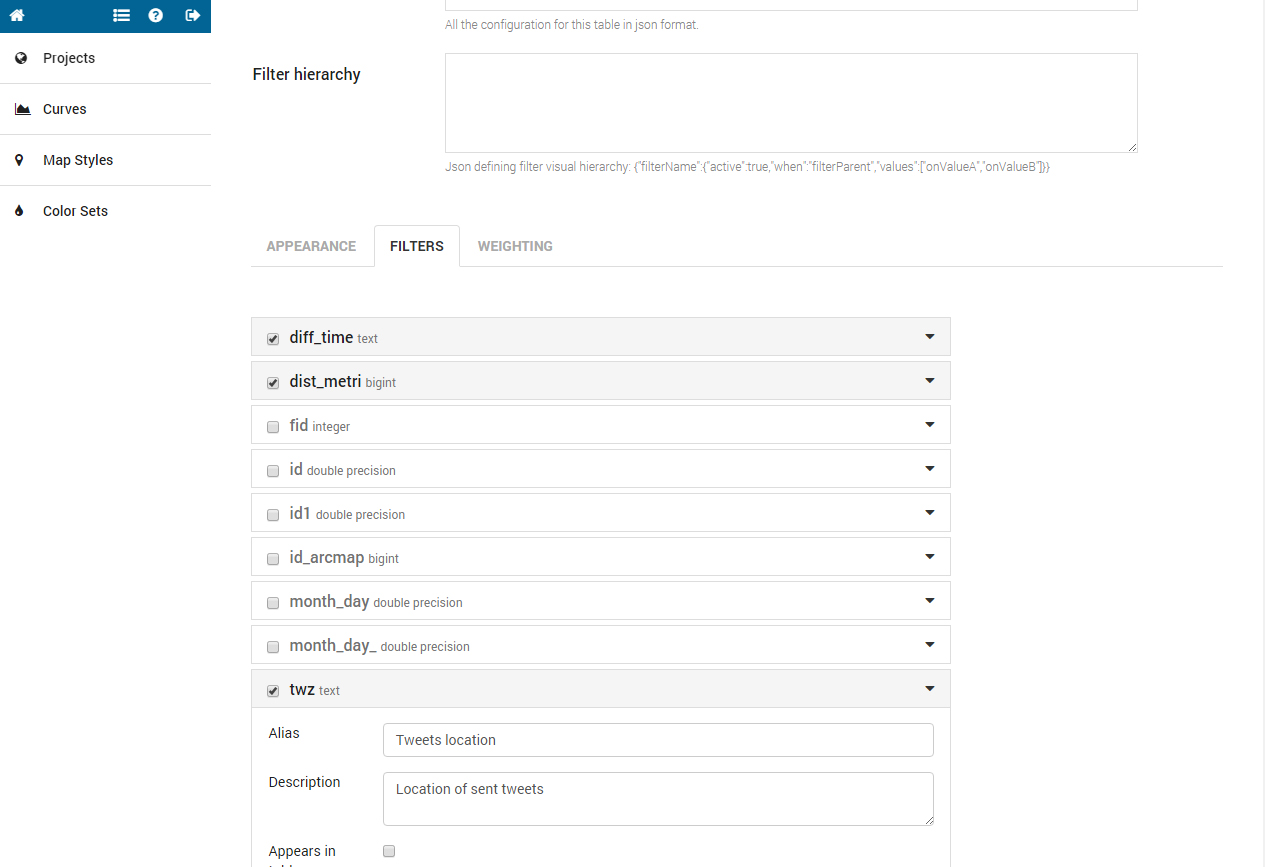
When opening the filtering section, you will find the list of fields included in the table.
______________________________________________________________
For each field, click on the arrow, open and compile the form.
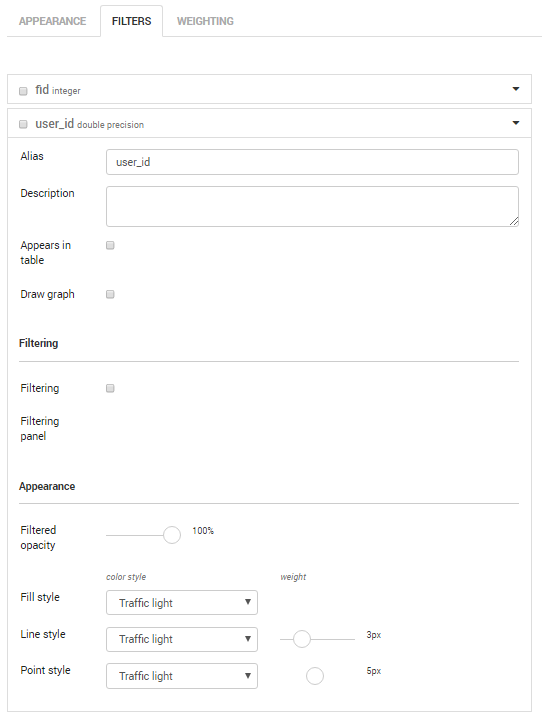
- Alias: is the name visible in the filtering section of data explorer.
- Description: is the name visible when passing with the mouse over the field’s name in the filtering section of data explorer.
- Appears in table: checking it enables the field to be visible in the table in data explorer.
- Draw graph: checking it enables the field to be visible in the graph in data explorer.
FILTERING (how to filter data included in each table field)
- Filtering: checking it enables the field to be visible in the filtering section of data explorer.
- Each kind of data can be visualised through different types of filters:
- checkbox: for text fields.
- dropdown menu: for text fields.
- range sliders: for numeric fields.
- single choice range sliders: for numeric fields.
- tag: for text fields in the [“text1″,”text2″,”…”] ]format
- Filtering panel: wrinting a name, you automatically create a panel containing the field. You can use the same panel’s name for different field in order to create sub-folders for visualization.
APPEARANCE (how to visualise data when the relative colour style is enabled by the final user)
- Filtered opacity: set the opacity of the geometry
- Fill Style: choose the set of colours for filling the geometry in relation to the values included in the table field.
- Line Style: choose the set of colours and width for lines and polygons’ perimeters in relation to the values included in the table field.
- Point Style: choose the set of colours and radius (n. of pixels) of point geometries in relation to the values included in the table field.
______________________________________________________________