3.3.6 Graphs
![]()
Clicking on the graphs icon (as shown in the image on the left), you can open the graphs relative to the project database.
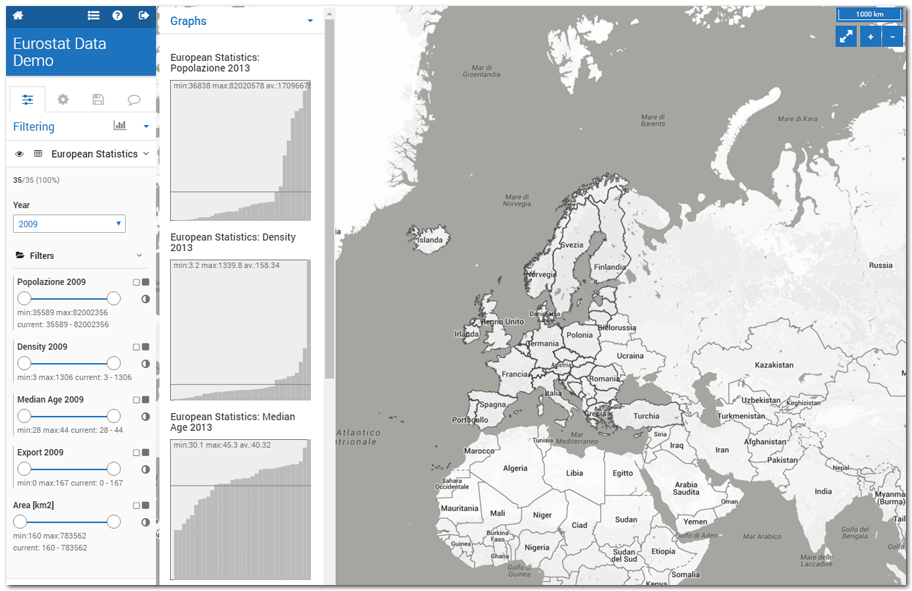
If you do not have selected any colour styles, the graphs appear gray. In this case, the graphs show only the trend of data and they average value (the horizontal line within the graph).
If you click on a colour style, the bar of the charts will assume the same colours of the geometries within the map, showing data according to the filters activated in the filtering section.
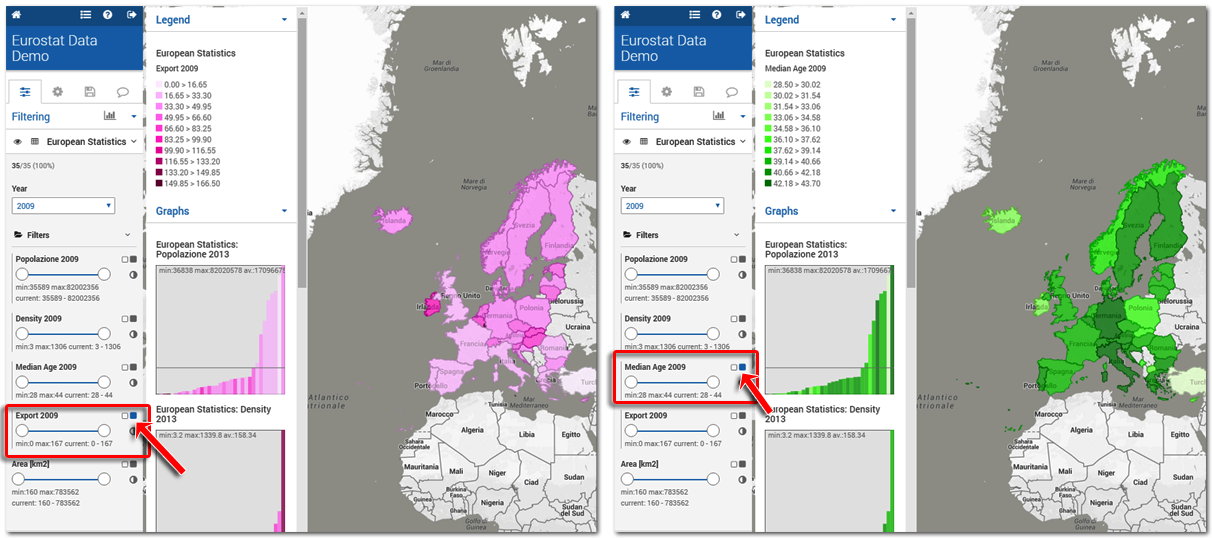
The graphs show the values of the filtered data in relation to the whole set of data, highlighting the selected geometries.