2.2“Curves” section
In order to calculate the influence of each layer on the other layers, InViTo makes use of mathematical curves which describe the behaviour.
The curve configuration sub-menu allows administrator users to create or edit one of the already available curve. For each curve archetype, users can set the radius of action, the intensity, and all the parameters that define the behaviour of the curve.
Once curves are edited, users assign them to the relative layer. Their working is then visible in the front interface.

The weights are calculated on the data filtered in the previous section of data filtering. Therefore, both administrator and public users have the opportunity to evaluate the response of different scenarios through an interactive and dynamic visualisation, which immediately provides the response of land to specific planning choices or policies.
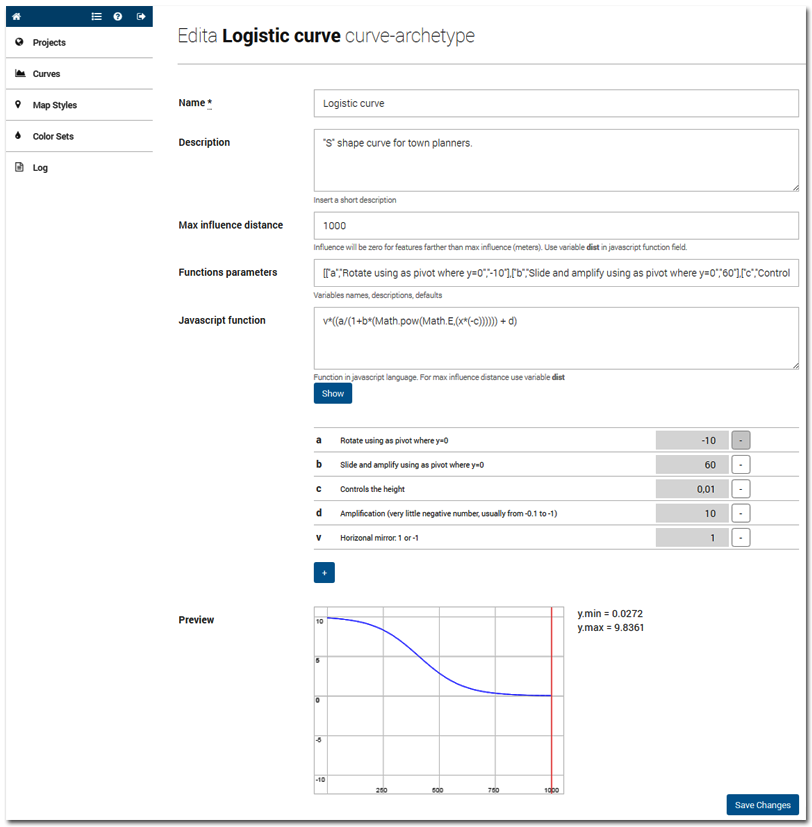
Curves assign a behaviour on the basis of a distance:
f(x)=d