3.1 Data Filtering
InViTo proposes a web interface where people can easily decide the information to see. The data filtering section allows data to be interactively selected and filtered by the end users in order to customise the visualisation.
All data can be selected and filtered through checkbox windows, dropdown menu or sliding cursors.
Filters can be grouped in specific panels, so that the visualisation of data is supported by specific steps to follow.
Specific buttons provide possibilities for enabling particular elements such as tables, graphs, analysis grids or background maps.
InViTo allows data to be investigated at different levels with also intersection of attributes, in order to analyse data clusters in relation to specific parameters.
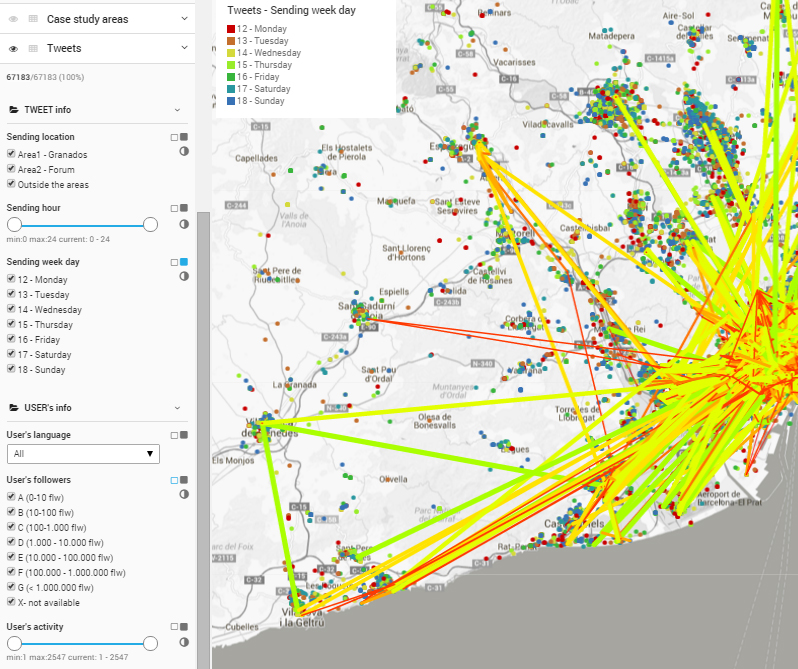
In order to filter data, explore the content of each layer clicking on the arrow on the right of the layer’s name. A number of sub-layers appear. Data in sub-layers can be filtered in five ways:
- moving the sliders and selecting the range of interest;
- (un)checking the checkbox:
- selecting the tag you want to include in your visualisation;
- selecting the sub-menu from a list of possibilities:
- clicking on the Invert icon, so that you can invert the selection of data.
Last but not least, during the visualisation on the front-end interface, some changes in the order of layers can be necessary. Therefore, users can change this order simply dragging up and down the layer name in menu on the left side of the front interface.